Accessories
Let's list all the components that will be useful to us to create an Arduino spectrometer and used in this project:
Equipment components
- Arduino Uno x 1
- Breadboard (without soldering) × 1
- IR LED × 1
- 5mm LED: red × 1
- 5mm LED: Green × 1
- LED, blue × 1
- UV LED × 1
- Resistor 10 ohm × 5
- Jumpers × 7
- Sandpaper × 1
- USB-A to B cable × 1
Software
- Arduino IDE
- Microsoft Excel
- Microsoft Data Streamer
And if you reach the end of our voluminous material, then you will also need, in addition to the Microcontroller, parts from Microbit:
- connector (pictured above, top left)
- Microbit (pictured middle left)
- icrmo USB cable (pictured below left)
Additional light sources:
- room light
- sunlight through the window
- sunlight outside
- changing light
- nail polish lamp
- UV flashlight (or UV LED connected to a coin cell battery)
- IR flashlight (or IR LED connected to a coin cell battery)
Important !
Please wear appropriate eye protection when performing any engineering projects or laboratory work. To create an analog spectrometer we will need the following parts, optional:
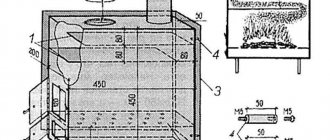
- Prism (optional) (A)
- UV balls (beads, beads) of the same color (B)
- Cardboard box (C)
Portable and stationary devices
This classification largely determines the division according to technical, structural and communication characteristics. Portable (mobile, pocket) devices look like small testers or multimeters. These are compact devices that can be used to control colors on surfaces with complex geometries, where the use of stationary equipment is impossible. Moreover, despite their small size, devices of this type effectively cope with the analysis of various coatings, regardless of texture and degree of grain.
A stationary spectrometer is a more functional device, equipped with powerful optical elements and data processing tools. As a rule, it has its own microprocessor with a system for visual presentation of the recorded spectra. The user can operate the equipment's own LCD display and keyboard.
Project idea
Orbiting Earth at an altitude of 250 miles or more than 400 km, crew aboard the International Space Station are exposed to higher levels of radiation than on Earth because they are outside the Earth's protective magnetic field.
For people on Earth and in space, radiation can be terribly dangerous. Most types of radiation are invisible to our eyes, and some of them can harm the human body. However, not all radiation is harmful and we sometimes need radiation. For this project, our goal was to teach students of all ages what electromagnetic radiation is, how we measure it, and the difference between harmless and harmful radiation.
This inexpensive spectrometer is made of infrared, red, green, blue and ultraviolet LEDs. With a spectrometer in hand, you can examine different light sources and detect different wavelengths in those light sources. You can then determine which light sources contain ultraviolet wavelengths and which materials block ultraviolet wavelengths so you know when and where to apply sunscreen. But we'll start with simple examples for class work.
Kaluga inventor observes the sun and the spectrum of stars from his garage
VIDEO ON THE TOPIC: ☢ Aizon bought a spectrometer [Oleg Aizon] Chemistry professor Alexander Shchilin Alexander Scheeline from the University of Illinois made a spectrometer out of a mobile phone to get schoolchildren interested in analytical chemistry. The professor assembled a chemist's basic scientific instrument from inexpensive materials and a digital camera. Spectrophotometry is one of the most widely used tools for identifying and quantifying materials. If you want to teach someone how to use a tool creatively and improve it, you need something simpler and clearer.” That's all you need to make a spectrometer.
The site helps you find something interesting in a huge range of stores and make a successful purchase. If you bought something useful, please share the information with others.
American dosimetric. German dosimetric No description. Search in the topic Printable version. Sent: October 31, —
It refers only to fluctuations of articulated speech in pitch and tempo and has no relation to non-verbal sound phenomena. Prosodic units are sometimes called prosodemes. For the reliability and completeness of recording a conversation with a patient with aphasia, it is also necessary to record the motor activity of the patient, who often tries to express himself in gestures. Clearly, gesture is an important aspect of paralinguistics; they may be affected to a much lesser extent than articulated speech.
Learning process
Creation and training
Students build a simple spectrometer using LEDs as light sensors for five different colors or wavelengths of light visible and invisible to humans: infrared (IR), red, green, blue, and ultraviolet (UV). Students connect their spectrometer to a microcontroller to detect the different wavelengths present in different light sources, to see how light emits different wavelengths, and to identify sources of ultraviolet light.
Connecting components
Students connect their spectrometer to Excel via a microcontroller. Students use graphics in an Excel "workbook" to visualize and observe changes in light wavelengths in different light sources.
Data visualization
Students use a digital spectrometer to visualize and compare the intensity and type of wavelengths emitted by different light sources. The lesson allows students to become temporary test scientists that examine the wavelengths present in different light sources to compare the light sources being tested and identify sources of UV wavelengths.
DIY spectroscope from a web camera. Homemade Fourier spectrometer
Friends, Friday evening is approaching, this is a wonderful intimate time when, under the cover of an alluring twilight, you can take out your spectrometer and measure the spectrum of an incandescent lamp all night, until the first rays of the rising sun, and when the sun rises, measure its spectrum. How come you still don't have your own spectrometer? It doesn’t matter, let’s go under the cut and correct this misunderstanding. Attention! This article does not pretend to be a full-fledged tutorial, but perhaps within 20 minutes of reading it you will have decomposed your first radiation spectrum.
Man and spectroscope
I will tell you in the order in which I went through all the stages myself, one might say from worst to best. If someone is immediately focused on a more or less serious result, then half of the article can be safely skipped. Well, people with crooked hands (like me) and simply curious people will be interested in reading about my ordeals from the very beginning. There is a sufficient amount of material floating around on the Internet on how to assemble a spectrometer/spectroscope with your own hands from scrap materials. In order to acquire a spectroscope at home, in the simplest case you will not need much at all - a CD/DVD blank and a box. My first experiments in studying the spectrum were inspired by this material - Spectroscopy
Actually, thanks to the author’s work, I assembled my first spectroscope from a transmission diffraction grating of a DVD disc and a cardboard tea box, and even earlier, a thick piece of cardboard with a slot and a transmission grating from a DVD disc was enough for me. I can’t say that the results were stunning, but it was quite possible to obtain the first spectra; photographs of the process were miraculously saved under the spoiler
Photos of spectroscopes and spectrum
The very first option with a piece of cardboard
Second option with a tea box
And the captured spectrum
The only thing for my convenience, he modified this design with a USB video camera, it turned out like this:
photo of the spectrometer
I’ll say right away that this modification freed me from the need to use a mobile phone camera, but there was one drawback: the camera could not be calibrated to the settings of the Spectral Worckbench service (which will be discussed below). Therefore, I was not able to capture the spectrum in real time, but it was quite possible to recognize already collected photographs.
So let's say you bought or assembled a spectroscope according to the instructions above. After this, create an account in the PublicLab.org project and go to the SpectralWorkbench.org service page. Next, I will describe to you the spectrum recognition technique that I used myself. First, we will need to calibrate our spectrometer. To do this, you will need to take a snapshot of the spectrum of a fluorescent lamp, preferably a large ceiling lamp, but an energy-saving lamp will also do. 1) Click the Capture spectra button 2) Upload Image 3) Fill in the fields, select the file, select new calibration, select the device (you can select a mini spectroscope or just custom), select what spectrum you have, vertical or horizontal, so that the spectra in the previous screenshot are clear programs - horizontal 4) A window with graphs will open. 5) Check how your spectrum is rotated. There should be a blue range on the left, and a red range on the right. If this is not the case, select the more tools – flip horizontally button, after which we see that the image has rotated but the graph has not, so click more tools – re-extract from foto, all peaks again correspond to real peaks.
6) Press the Calibrate button, press begin, select the blue peak directly on the graph (see screenshot), press LMB and the pop-up window opens again, now we need to press finish and select the outermost green peak, after which the page will refresh and we will get a calibrated wavelengths image. Now you can fill in other spectra under study; when requesting calibration, you need to indicate the graph that we have already calibrated earlier.
Screenshot
Type of configured program
Attention! Calibration assumes that you will subsequently take photographs with the same device that was calibrated. Changing the resolution of the images in the device; a strong shift in the spectrum in the photo relative to the position in the calibrated example can distort the measurement results. Honestly, I edited my pictures a little in the editor. If there was light somewhere, I darkened the surroundings, sometimes rotated the spectrum a little to get a rectangular image, but once again, it is better not to change the file size and the location relative to the center of the image of the spectrum itself. I suggest you figure out the remaining functions like macros, auto or manual brightness adjustment yourself; in my opinion, they are not so critical. It is then convenient to transfer the resulting graphs to CSV, in which the first number will be a fractional (probably fractional) wavelength, and separated by a comma will be the average relative value of the radiation intensity. The obtained values look beautiful in the form of graphs, built for example in Scilab
SpectralWorkbench.org has apps for smartphones. I didn't use them. so I can't rate it.
Have a colorful day in all the colors of the rainbow, friends.
In previous articles, I described how I tested various LEDs for plants. To analyze the spectrum, I took some from a friend's physics teacher.
But the need for such a device appears periodically and a spectroscope, or even better, a spectrometer, would be desirable to have at hand.
My choice is a jewelry spectroscope with a diffraction grating
Since the item was for jewelers, it came with a “leather” case
The spectroscope is small in size
What else was clear from the description of the store: Everything is assembled tightly, so there will be no dismemberment. Let’s also believe that on one side of the tube there is an objective lens, on the other there is a diffraction grating and protective glass.
And inside there is a beautiful rainbow. Having admired it to my heart’s content, I began to look for something to look at on the spectrum. Unfortunately, it was not possible to use the spectroscope for its intended purpose, since my entire collection of diamonds and precious stones was limited to a wedding ring, which was completely opaque and did not provide any spectrum. Well, perhaps in the flame of the burner))). But the mercury fluorescent lamp honestly produced many beautiful stripes. Having admired various light sources to my heart’s content, I was puzzled by the question that I needed to somehow capture the picture and measure the spectrum.
A little DIY
A picture of a camera attachment had been spinning in my head for a long time, and under the table stood a camera that had not yet undergone the latest modernization, but was quite successfully coping with PVC plastic.
The design turned out not very beautiful. Still, I did not completely overcome the backlash in X and Y. Nothing, the ball screws are already assembled and are waiting for the supporting linear rails to arrive.
But the functionality turned out to be quite acceptable, so that the rainbow would be displayed on an old Canon that had been lying idle for a long time.
True, disappointment awaited me here. The beautiful rainbow became somehow discrete.
It's all the fault of the RGB matrix of any camera. After playing with the white balance settings and shooting modes, I came to terms with the picture. After all, the refraction of light does not depend on what color the image is captured in. For spectral analysis, a black-and-white camera with the most uniform sensitivity over the entire width of the measured range would be suitable.
Technique of spectral analysis.
Through trial and error, the following method was drawn: 1. A picture of the scale of the visible range of light (400-720 nm) is drawn, and the main mercury lines for calibration are indicated on it.
2. Several spectra are taken, always with a reference mercury. In a series of photographs, it is necessary to fix the position of the spectroscope on the lens in order to exclude a horizontal shift of the spectrum from the series of photographs.
3. In the graphic editor, the scale is adjusted to the mercury spectrum, and all other spectra are scaled without horizontal shift in the editor. It turns out something like this
4. Well, then everything is put into the Cell Phone Spectrometer analyzer program from this article
We test the method on a green laser, whose wavelength is known - 532 nm
The error turned out to be about 1%, which is very good with the manual method of adjusting mercury lines and drawing the scale almost by hand. Along the way, I learned that green lasers are not direct radiation, like red or blue ones, but use solid-state diode pumping (DPSS) with a bunch of secondary radiation. Live and learn!
Measuring the wavelength of the red laser also confirmed the correctness of the technique
Just for fun, I measured the spectrum of the candle
and burning natural gas
Now you can measure the spectrum of LEDs, for example “full spectrum” for plants
The spectrometer is ready and working. Now I will use it to prepare the next review - a comparison of the characteristics of LEDs from different manufacturers, whether the Chinese are fooling us and how to make the right choice.
In short, I'm pleased with the result. It might make sense to connect the spectroscope to a webcam for continuous spectrum measurement, as in this project
Testing the spectrometer by my assistant
Be sure to watch the videos on the channels (there are thematic playlists):
https://www.youtube.com/channel/UCn5qLf1n8NS-kd7MAatofHw
https://www.youtube.com/channel/UCoE9-mQgO6uRPBQ9lsPZXxA
Please help me gain 1000 subscribers on the first channel and at least 4000 hours of views over the last year on each of them, to do this, watch at least one video in its entirety!
This beautiful picture is a photograph of the light and infrared spectrum emitted by a high pressure sodium lamp of the type DNaT (Arc Sodium Tubular). To view and photograph various spectra, it is enough to have a digital camera and a specially prepared CD-R or DVD-R. The latter reduces the brightness, especially of red. CD-R reduces the brightness of blue and gives lower resolution. The first photo was taken via DVD-R.
The two yellow lines are the sodium doublet with wavelengths of 588.995 and 589.5924 nm. The second doublet is infrared 818.3 and 819.4 nm.
Spectrum graph.
Now a few words about preparing disks. You need to cut out a part from the disk that allows you to completely cover the lens.
The DVD-R is purple in the photo. We need a transparent diffraction grating, so we stick wide tape on the CD-R on the side of the inscriptions. We tear it off and remove the disk covering together with the tape. With DVD-R it’s even easier; the cut piece can easily be separated into two parts, one of which is what we need.
Now, using double-sided tape, you need to glue the diffraction grating to the lens, as in the photo below. You need to glue it on the side opposite to the one from which the layer was torn off, because... the surface under the layer will easily become dirty from the lens, and after cleaning the quality of the spectrum image will be worse.
The result was a simple spectroscope, best suited for studying light sources from a certain distance.
If we want to explore not only the visible spectrum, but also the infrared, and in some cases ultraviolet, then it is necessary to remove the filter that blocks IR rays from the camera. It is worth noting that part of the IR and UV spectrum is visible to the eye at a sufficiently high radiation intensity (laser points 780 and 808 nm, LED crystal 940 nm in the dark). If it is necessary to provide the same visual sensation for wavelengths 760 nm and 555 nm, then the radiation flux for 760 nm must be 20,000 times more powerful. And for 365 nm it is a million times more powerful.
Let's return to the filter, which is called Hot Mirror and is located in front of the matrix. You need to open the camera body, unscrew the screws attaching the matrix to the lens, remove the filter, and assemble the camera in the reverse order. Hot Mirror looks like this:
2 left filters from cameras. They have a pink sheen and the turquoise color comes out from a different angle. In addition to IR, they can also partially or completely block ultraviolet rays. Therefore, their removal opens up the possibility of not only infrared photography, but also ultraviolet photography, if the optics and matrix of the camera allow. For UV photography, UV-pass filters are used to block visible light.
Now let's move on to the process of photographing the spectra. The room should be dark; in addition, you can use a black screen near the camera, a point or slit light source that minimally illuminates the room. Turning on the camera, we will see this image using the example of a 405 nm laser shining through a narrow slit between two blades:
The central point is the laser itself. Two lines are its spectrum. You can use any of them. To do this, you need to turn the camera and zoom in. If we continue to move the camera, we will see several other lines of the second, third, etc. orders of spectrum. In some cases they will interfere, for example the second order green line will overlap the 1064 nm infrared line. This occurs in the spectrum of a green laser if it does not have a filter that cuts off IR radiation. It's bottom right in the filter photo. To remove the overlay, I used a red filter. Photo of this example with labeled wavelengths:
As can be seen, the second-order green line completely covered the 1064 nm line. And the next photo is with the green light blocked, where only two IR lines remain: 808 nm and 1064 nm. I didn’t sign because... The location is identical to the previous photo.
From an image where there is a radiation source, one known wavelength and several unknowns, they can be easily identified. For example, open a photo with captions in Photoshop. Using the “Ruler” tool, measure the distance from the laser to line 532. It is equal to 1876 pixels. We measure the distance from the laser to the line whose wavelength we want to know, up to 808. The distance is 2815 nm. We calculate 532 * 2815/1876 = 798 nm. Inaccuracy occurs due to distortion of the lens optics. At maximum optical zoom, the error decreases. It has also been observed that the 808 nm laser emits a shorter wavelength, around 802 nm, and has a shorter wavelength as the supply current decreases.
And without a radiation source in the photo, you can determine it by knowing the other two wavelengths. We measure the length from line 532 to 1064, there are 1901 p. From 532 to 808 it turns out to be 939 p. We count (1064-532)/1901*939+532=795 nm.
But the easiest way is to compare a photograph with two known lines with a scale. In this case, there is no need to count anything.
Next is the spectrum of an incandescent lamp, which is very similar to the spectrum of the Sun, but does not contain Fraunhofer lines. Interestingly, the camera displays infrared radiation up to 800 nm as orange, and above 800 nm it appears as violet.
The spectrum of the white LED is also continuous, but has a dip in front of the green region and a peak in the blue region of 450-460 nm, which is caused by the use of a corresponding blue LED coated with a yellow phosphor. The higher the color temperature of the LED, the higher the blue peak. It lacks ultraviolet and infrared rays that were present in the spectrum of an incandescent lamp.
And here is the spectrum of a cold cathode lamp from the monitor backlight. It is lined and exactly repeats the spectrum of a fluorescent lamp. The IR part of the spectrum is taken from the CFL to obtain better image quality.
Now let's move on to the ultraviolet black light lamp, or, as it is also called, Wood's lamp. It emits soft long-wave ultraviolet light. The photo turned out like this:
The infrared radiation spectrum of fluorescent lamps, CCFL, and Wood lamps is almost the same. Only the latter lacks several lines closest to the visible range. IR rays are most intensely emitted from those parts of the lamps where the filaments are located. The photograph was taken through a paper spectroscope, more about which below.
Spectroscope made of paper.
This spectroscope is well suited for viewing the spectrum with the eye. It can also be used with different cameras, such as telephone cameras. There are two varieties.
1. Works through transmission through a diffraction grating. For it you need to prepare disks as described above. The file contains a drawing that needs to be printed, cut, folded and glued. Assembly pictures can be viewed.
2. Works on reflection from a diffraction grating. You don’t have to delaminate the disks, but then pale duplicating ones will appear next to the bright lines from the lasers, due to re-reflections inside the disk, which should not exist in the spectrum. It is very difficult to transfer the shiny layer of a CD to another surface so that it remains the same smooth. Therefore, you need to use a CD that has the same iridescent surface on both sides. On the side where there are inscriptions on regular discs, you need to tear off the transparent layer using tape. It is important that the shiny layer remains on the disc. I managed to do this with half the disk (from the edge to the center), this was enough for the spectroscope. If you do not tear off the transparent layer, the uniform spectrum will appear discontinuous with alternating dark stripes.
File for printing. Assembly help.
An additional ring is glued to the spectroscope, with which it is held on the camera lens. It is recommended to place a matte film or a prism with two matte edges between the light source and the spectroscope, as in the photo, for better light distribution. The inside of the spectroscope is made of black paper without shine, the second layer is made of foil, and on top is plain paper on which the drawing is printed. The side where the light enters can be painted black so that UV and violet radiation does not cause the paper to glow white, distorting the picture.
Using this spectroscope, it was possible to clearly and brightly photograph the spectrum of a neon indicator lamp. They are used to illuminate switches, in indicators of operation of kettles, stoves and other appliances.
Not only lasers provide one thin line of the spectrum. If the wire is dipped into a NaCl salt solution and then brought into the fire of a gas turbo burner or lighter, a yellow glow will appear with wavelengths of 588.995 and 589.5924 nm.
Some turbo lighters have a plate containing lithium. It colors the flame red with a line of 670.78 nm.
Below is a photograph of these spectral lines along with the laser lines: green 532 nm, red 663 nm, infrared 780 nm and 808 nm.
It is convenient to use the yellow light described above to determine the period of the diffraction grating in the absence of a laser, and to calculate the wavelength of light sources. The simplest device in the figure below consists of two rulers, on one of which a diffraction grating is attached, and above the second there is a narrow slit of two blades. The distances in millimeters from the diffraction grating to the screen (ruler) with the slit and from the slit (zeroth order maximum) to the first order maximum are used. In the first picture, you look through a diffraction grating at a light source with a known wavelength. Thus, you can calculate the period of the diffraction grating using the formula under this image, and then, using the same method, you can determine the wavelength, but using the formula from under the second figure. It shows determining the laser wavelength in a slightly different way: the laser shines through a diffraction grating onto a ruler. In this case, a gap is not needed. I used the diffraction grating from the Starry Sky attachment that came with the laser pointer. There are two grates, but the nozzle was disassembled and one grate was pulled out. The CD diffraction grating was not suitable at all, because... gave a huge error of 100 nm.
The following photo is of a rare light source - lightning. The spectrum extends into the UV range to approximately 373 nm, which is the limit for this camera.
The spectrum of a white discharge lamp that illuminates a football field.
Photo of the spectrum of the UV LED 365 nm 3 W KW-UV-3WS-B KonWin.
An LED with a wavelength of 365 nanometers has the following crystal:
It emits ultraviolet light along with white light. If you shine a black light lamp on a switched-off LED, the crystal begins to fluoresce with the same lunar white light as when the LED itself is operating, but with less brightness. It appears that this effect prevents LEDs from producing pure 365 nm - 370 nm emissions.
Measuring UV light using beads and a prism (optional)
1. Place the prism in a straight line of bright sunlight (this works even better if you go outside).
2. Rotate the prism until you bend the light and create a rainbow.
3. Place the cardboard box so that the rainbow fits inside the box.
4. Place one bead in each light strip, as well as one behind the purple and one behind the red.
5. Wait two minutes and then block the light. Record the color of the beads in your lab notebook.
Laser analyzers of metals and alloys
“Newcomer” in the market of portable equipment for chemical control. For identification, the deep scanning method is used, in scientific words - this is the use of quantum laser radiation. In theory, this method was created as an alternative to X-ray fluorescence, an attempt to “close” the inherent disadvantage of the X-ray fluorescence method in determining carbon (C)
.
Now there are many beautiful and visual videos on the Internet, where a laser spectrometer “accurately” determines the steel grade and shows a low value for the main distinguishing feature, the ability to measure carbon grades.
We have our own laboratory where we independently test and customize devices to meet Customers’ needs. We know and can clearly demonstrate that quantum laser technology is very crude and imprecise. The main disadvantage is the poor repeatability of the results, for example: we take steel grade 316L
Chemical composition in % of steel AISI 316L (analogue 03Х16Н15М3)
Ultraviolet Measurement Using Beads
1. Collect UV balls and divide them into three groups of ten balls.
2. Place one group of UV balls inside near the window.
3. Place the second group of UV balls under the indoor light source.
4. Place the third group of UV balls outside in the street.
5. Wait five minutes, then observe changes in three different groups of UV beads. Describe your observations in your lab notebook.
Making a spectrometer
1. Hold one LED by the bulb and sand it until the top is flat.
2. Repeat this for all LED bulbs.
Why do we grind the tops of LEDs?
You'd probably think that by sanding the top of the LEDs you're blocking the light from reaching the sensor, and you're right, some of the light will be blocked.
Sanding makes the light that passes through the LED more diffuse, so more light reaches the sensor than when the LED is clear.
This makes it easier for your spectrometer to detect changes in the light falling on it. If you have extra time, try sanding at different angles to see how it affects your measurements.
What is a spectrometer?
A spectrometer can measure different colors or wavelengths of light in different light sources.
For this project, we are using a microcontroller to measure the energy generated by our LEDs when light shines on them.
In other words, we use an LED as a sensor for specific wavelengths of light.
How to make a spectrometer from a mobile phone? There is a simple recipe
Come in, please. Habr Geektimes Toaster My circle Freelansim. Log in registration. Spectral analysis at home DIY or Do it yourself Tutorial Friends, Friday evening is approaching, this is a wonderful intimate time when, under the cover of an alluring twilight, you can take out your spectrometer and measure the spectrum of an incandescent lamp all night, until the first rays of the rising sun, and when the sun rises, measure it too range. How come you still don't have your own spectrometer? It doesn’t matter, let’s go under the cut and correct this misunderstanding. This article does not pretend to be a full-fledged tutorial, but perhaps within 20 minutes of reading it you will have decomposed your first radiation spectrum.
Digital spectrometer connection diagram
- Connect a jumper wire between the 3.3V and the AREF on the Arduino.
- Connect a jumper between the longer leg of the LED and pin A0 .
- Connect a jumper between the GND and the negative bus on the breadboard.
- Connect 10 ohm resistor between the shorter LED leg and the negative bus of the breadboard.
- Insert the LED into the breadboard so that both wires are in two different rows. Start with an infrared (IR) LED.
Check Point
Make sure the LED is connected correctly and is sending data to Excel.
Connect the Arduino to your computer, connect it to the Data Streamer and check that the data is printed to Radiation.
Make sure the LED readings change by placing them under a light source. The best way to see change is to get outside! Even if it's cloudy, LEDs respond best to sunlight.
Before all LEDs are connected, there may be erroneous data coming from channels with unconnected LEDs. We connect the remaining LEDs.
- Repeat the steps above for all remaining LEDs. Don't forget to connect the signal wire back to the Arduino analog pins!
- The red LED is connected to pin A1 . The green LED is connected to pin A2 . The blue LED is connected to pin A3 . The ultraviolet (UV) LED is connected to pin A4 .
The final diagram above, drawn in Fritzing for a 5-LED spectrometer: IR, red, green, blue and UV.
Interesting fact . A thin layer of gold on the visor of an astronaut's helmet protects against the dangerous effects of solar radiation.
Project code
You can copy or download the project code below:
// ———————HackingSTEM EM Spectrum——————————- // This project is for use with the EM spectrum lesson plan // available from Microsoft Education Workshop at https://aka. ms/hackingSTEM // // Overview: // This sketch uses LEDs as light sensors (photodiode) to detect and measure // different wavelengths in various types of light sources.
// // Pins: // Pin A0: IR LED // Pin A1: Red LED // Pin A2: Green LED // Pin A3: Blue LED // Pin A4: UV LED // // This project uses an Arduino UNO microcontroller board. More information can // be found by visiting the Arduino website: // https://www.arduino.cc/en/main/arduinoBoardUno // // Comments, contributions, suggestions, bug reports, and feature requests // are welcome ! For source code and bug reports see: // https://github.com/ // // Copyright 2022, Jen Fox, Microsoft EDU Workshop - HackingSTEM // MIT License terms detailed in LICENSE.txt // ————— ————————————————————- // Program variables for project sensors ————————————— const int kNumberOfLeds = 5; int kledPins[kNumberOfLeds] = {A0, A1, A2, A3, A4}; // Excel variables for storing data sent to Excel —————————— int colorSensors[kNumberOfLeds] = {1, 2, 3, 4, 5}; //Serial data variables const char kDelimiter = ','; const int kSerialInterval = 50; unsigned long serialPreviousTime; // SETUP ———————————————————————- void setup() { // Initializations occur here Serial.begin(9600); _SFR_IO8(0x35) |= 0x10; // A condensed method for disabling the internal // pull up resistors in the Arduino. // This function changes the reference voltage for measuring the analog voltage // of the LEDs to a 3.3V reference. This is why we added the jumper cable // between 3.3V to AREF! analogReference(EXTERNAL); } // START OF MAIN LOOP ——————————————————— void loop() { // Process sensors processSensors(); // Process and send data to Excel via serial port (Data Streamer) processOutgoingSerial(); } // SENSOR INPUT CODE———————————————————— void processSensors() { // Read analog value of LED inputs for(int i = 0; i < kNumberOfLeds; i++){ colorSensors = analogRead(kledPins ); } delay(10); //short delay to prevent the Arduino from overclocking } // Add any specialized methods and processing code here // OUTGOING SERIAL DATA PROCESSING CODE—————————————- void sendDataToSerial() { // Send data out separated by a comma (kDelimiter) for(int i = 0; i < kNumberOfLeds; i++){ Serial.print(colorSensors ); Serial.print(kDelimiter); } Serial.println(); // Add final line ending character only once } //—————————————————————————— // DO NOT EDIT ANYTHING BELOW THIS LINE //— ————————————————————————— // OUTGOING SERIAL DATA PROCESSING CODE —————————————- void processOutgoingSerial() { // Enter into this only when serial interval has elapsed if((millis() - serialPreviousTime) > kSerialInterval) { serialPreviousTime = millis(); // Reset serial interval timestamp sendDataToSerial(); } }
Downloading Arduino Code
1. Install Arduino IDE. You can follow the link or even through the Microsoft Store. Follow the instructions to complete the installation.
2. Download or copy the code we provided above. You can also download the current version from this link on the Microsoft website.
3. Open the downloaded file to launch the Arduino IDE application.
4. In the Arduino application, select: Tools -> Port -> COM 3 (Arduino / Genuino Uno), for the English version of the program: Tools -> Port -> COM 3 . Your port may be different from COM3.
5. Then select Tools -> Board: Arduino / Genuino Uno. In English: Tools -> Board: Arduino/Genuino Uno .
6. Click on the round right arrow button to download the code.
Processing the result
We combine the spectrum of the calibration lamp and the spectrum under study in one frame. Knowing the location of the known mercury lines, it is possible to determine the desired wavelength through measurements and subsequent calculations.
On the left is the spectrum of the calibration lamp. Flame spectrum in the center
Useful links:
Spectral Workbench website. Using the programs on the site, you can process the spectra and obtain intensity graphs depending on the wavelength.
Information system “Electronic structure of atoms”. A very convenient Russian-language resource on spectral data of atoms and ions.
Creating a spectrometer for micro:bit
- Insert your micro:bit into the connector , then insert it into the layout as shown in the diagram above.
- Connect the connecting wire between the long LED leg and the pin 0.
- Connect the bond wire from the GND on your micro:bit to the negative rail on the breadboard.
- Connect a resistor between the short leg of the LED and the negative bus.
- Insert the LED into the breadboard so that both wires are in two different rows. Start with an infrared (IR) LED.
Check Point
Make sure the LED is connected correctly and is sending data to Excel. Connect the micro:bit to your computer, connect it to the Data Streamer (instructions below) and check that the data is printed to Radiation.
Make sure the LED readings change by placing them under a light source. The best way to see change is to get outside! Even if it's cloudy, LEDs respond best to sunlight.
Before all LEDs are connected, there may be erroneous data coming from channels with unconnected LEDs. We continue with the remaining LEDs.
- Repeat the previous steps for all remaining LEDs.
- The second LED is connected to pin 1 . The third LED is connected to pin 2 . The fourth LED is connected to pin 3 . The fifth LED is connected to pin 4 .
Required material for making a plasma ball lamp
We offer the easiest way to make a Tesla plasma ball at home.
To make an electric light sphere at home, you will need the following materials:
- incandescent lamp;
- line transformer (you can buy it very cheaply on the radio market or get it from an old TV);
- an energy-saving lamp (we will use its diodes to generate lightning in the electric light sphere);
- wire with a plug for plugging into a socket.
Download micro:bit code
1. Follow this link to download the .hex .
2. Connect the micro:bit to your computer using a USB cable. Install the mbed . If you've done it before, you won't have to do it again. If not, then follow the instructions below.
Windows Serial Driver
You can connect your board to your computer via USB. Everything should work out of the box on Linux and Mac OS X, but for Windows earlier than Windows 10, you'll probably need to install a serial driver:
- Download the Arm Mbed Serial Port Driver for Windows.
- Connect your Arm Mbed device via USB. It is mounted as an Mbed disk.
- Close any Explorer windows that show the Mbed drive.
- Run the installer. May take a while or display multiple warnings about "unsigned driver" or unsigned driver.
Possible problems
- If you have multiple Mbed devices but the serial port is only showing for one of them: make sure you run the installer for each device (connect the device via USB and run the installer again); Windows loads the driver based on the serial number, so you need to run it on a per-device basis.
- If the installer does not work due to missing mbed microcontrollers: check if the device is properly connected via USB.
- If the installer reports that mbedWinSerial_nnnnn.exe is not a valid Win32 application: If you downloaded the installer using Internet Explorer, try a different browser (Firefox, Chrome).
- If the installer freezes: check if Windows displays the “unsigned driver/permission” window; they are often hidden behind other windows, with nothing showing on the taskbar. The installer will continue working once you click OK.
3. In File Explorer, navigate to micro:bit . It will look like an external storage device (such as a flash drive, hard drive, etc.).
4. Open a second Explorer window and go to your downloads folder. Make sure you can see both windows.
5. Select the .hex from the downloads and drag it into the micro:bit .
6. When the LED stops flashing, the code has been loaded into the micro:bit .
Principle of operation
The electric ionic sphere works as follows: since the Tesla plasma ball contains electrodes inside itself, when the voltage generation unit is generated, they take all its power upon themselves and start a process called “Gas Ionization”.
In simple terms, the ionization of the plasma ball inside the lamp simply makes the gas electrically conductive.
During this reaction, plasma is generated inside the lamp.
Open Excel and enable Data Streamer
Data Streamer with Excel 365: A 365 subscription includes Excel and the free Data Streamer add-in.
1. Open Excel 365.
2. Click File and select Options located at the bottom of the panel.
3. Select Add-ins in the dialog box that opens.
4. From the Manage menu at the bottom of the dialog box that opens, select COM Add-Ins and click Go .
5. Check the box (check the box) for Microsoft Data Streamer in the dialog box that opens and click OK .
6. You should see a new Data Streamer tab in the Excel menu.
Data Streamer with Excel 365 desktop version . For a limited time, Data Streamer can be used with the desktop version of Excel 2016. Download Data Streamer from the Microsoft Store. Once installed, Data Streamer will be automatically included in Excel.
How to make a plasma ball yourself at home: detailed instructions
The Tesla plasma ball is a very beautiful and interesting device. Staring at how lightning is directed towards your fingers is quite a spectacular and beautiful experience. But purchasing an electric light vessel in a store is too expensive. In addition, most likely children will not play with this device for a very long time. In this article, we decided to tell you how you can kill two birds with one stone. Below we share information on how you can make a plasma ball with your own hands in just a few minutes.
Getting data into Excel
Open the Radiation Excel workbook. If you haven't already, download the Excel workbook here. To see real-time data, follow these steps:
- Connect the microcontroller to the USB port of your computer.
- Click Connect to connect the microcontroller to Excel.
- Open the "Data Streamer" tab in the Excel menu.
- Click Start Data to start reading data in Excel
- To connect your device, connect it to your computer via USB and click Connect a Device.
- If you have recorded and saved a data file (.csv), you can import it using this button (Import Data File).
- Once your device is connected, select "Start Data" to start streaming data to Excel. If you don't click "Start Data" when your device is connected, you won't see any active data.
Troubleshooting Arduino
Is your Arduino board connected but you are not receiving any data or the data is not responding? Follow these steps to resolve the issue.
Make sure the Arduino is reading data into the Data Streamer:
- On the Data Streamer tab, click "Connect Device" and select the Arduino board.
- Click " Start Data " and go to the "Data In" tab . If it is successfully connected, you will see numbers on the screen.
Verify that the Arduino code has been successfully uploaded to the board. The Arduino program should say "Uploaded Successful" on the bottom status bar and you should see the Arduino lights on the board flashing.
Make sure all ground ( GND ) wires are connected to the same point.
Check the polarity or orientation of your LEDs. The longer LED wire must be connected to the analog input pins.
The signal from the sensor usually does not occur when the signal wire is connected to ground. Make sure the LED leads are in two different rows of the layout and that the resistor is connected to the shorter LED lead.
Make sure all parts are connected to the layout correctly. Check one LED at a time. Once you have checked the LED electrical connections, check the readings in Excel and see if the readings change in the sun.
Troubleshooting micro:bit
micro:bit board connected but you are not receiving any data or the data is not responding? Follow these steps to help resolve the issue.
Make sure the micro:bit is reading into the Data Streamer.
- On the Data Streamer tab, click "Connect Device" and select the Arduino board.
- Click " Start Data " and go to the "Data in" tab . If everything is successful, you will see numbers printed on the screen.
Verify that the micro:bit code has been successfully downloaded to the board.
- Drag and drop the code ( .hex file) into the micro:bit (see above) and check that the board's lights are blinking. When the lights stop, the code is loaded.
Make sure all negative or ground wires are connected to the same point.
Check the polarity or orientation of your LEDs. The longer LED wire must be connected to the analog input pins.
Make sure all parts are connected to the layout correctly.
Check one LED at a time. Once you have checked the LED electrical connections, check the readings in Excel and see if the readings change in the sun.
Spectral analysis at home
Friends, Friday evening is approaching, this is a wonderful intimate time when, under the cover of an alluring twilight, you can take out your spectrometer and measure the spectrum of an incandescent lamp all night, until the first rays of the rising sun, and when the sun rises, measure its spectrum. How come you still don't have your own spectrometer? It doesn’t matter, let’s go under the cut and correct this misunderstanding. Attention! This article does not pretend to be a full-fledged tutorial, but perhaps within 20 minutes of reading it you will have decomposed your first radiation spectrum.
Man and spectroscope
I will tell you in the order in which I went through all the stages myself, one might say from worst to best. If someone is immediately focused on a more or less serious result, then half of the article can be safely skipped. Well, people with crooked hands (like me) and simply curious people will be interested in reading about my ordeals from the very beginning. There is a sufficient amount of material floating around on the Internet on how to assemble a spectrometer/spectroscope with your own hands from scrap materials. In order to acquire a spectroscope at home, in the simplest case you will not need much at all - a CD/DVD blank and a box. My first experiments in studying the spectrum were inspired by this material - Spectroscopy
Actually, thanks to the author’s work, I assembled my first spectroscope from a transmission diffraction grating of a DVD disc and a cardboard tea box, and even earlier, a thick piece of cardboard with a slot and a transmission grating from a DVD disc was enough for me. I can’t say that the results were stunning, but it was quite possible to obtain the first spectra; photographs of the process were miraculously saved under the spoiler
Spectrometer Data Collection
Download the customized Excel workbook from this link. Below is a screenshot of an approximate view - click to enlarge.
The current data is visible on the left graph. This is where we also calibrate or zero our sensors. The histogram shows the average readings of the sensors, and the line shows the instantaneous readings. To calibrate the sensors, place the spectrometer in the box and close the lid. Allow readings to be taken for 10 seconds and then press the calibration button.
You will probably notice that the sensor takes some time to take readings. When measuring data, be sure to wait 5 to 10 seconds to get an accurate reading.
Once you have a reading for a specific light source, click Save trial on the desired chart to save the current data in the chart for comparison with other light sources. Label the light source for each trial at the top of the table.
How do X-ray fluorescence spectrometers work and where are they used?
XRF spectrometers operate according to the following principle:
- The sample under study is excited by X-rays.
- The resulting fluorescent radiation is reflected from the analyzer crystal and recorded by the detector.
- The angle of incidence of the radiation changes, thus reflecting different spectra, which are also recorded in turn by the detector.
These devices are used to determine the content of various chemicals. elements in substances. At the same time, their physical state does not matter - experiments can be carried out with gas, liquid and solid. In this way, you can determine the presence and percentage of metals, including precious metals, calcium, iodine, sulfur, chlorine, and analyze soil, water, and minerals.
Working with an X-ray fluorescence spectrometer
X-ray fluorescence spectrometers are used in:
- Metallurgy.
- Food Industry.
- Mechanical engineering.
- Mining industry.
- When processing rare metals.
- Ecology and agriculture.
The devices can often be found in forensic and forensic laboratories.
Measuring light with a spectrometer
1. While the spectrometer is still connected to your computer and sending data to Excel, collect data from the same light sources you used with the beads.
2. Place the spectrometer on the windowsill, wait 10 seconds and save the data.
3. Place the spectrometer under the same internal light source that you used for the UV beads, wait 10 seconds and save the data.
4. Take the spectrometer and computer outside, wait 10 seconds and save the last sample.
That's all. The material turned out to be large, but we hope it is very useful.
Features of the structure of the plasma ball
The plasma ball lamp consists of literally three elements: the outer glass bulb of the tesla lamp, the electrode (located inside the ionic vessel with lightning) and the block that generates high voltage inside the electric light sphere.
But there is one important feature that the light vessel with lightning contains. It consists of this: a plasma ball lamp contains a discharged inert gas inside a glass bulb. This factor must be taken into account when you make a Tesla ionic sphere at home.
Another feature of the structure of the Tesla plasma device is that it does not have any filaments. This means that even a homemade electric light vessel will last quite a long time.